
Hard Drive Failure Rates in Q2 2026: What 354,415 Drives Show
Backblaze's Q2 2026 Drive Stats put the fleet at a 1.73% failure rate. Our recalculation shows age is the clearest signal in the data.

In this article 8 sections
Hard drive failure rates hit 1.73% in Backblaze's Q2 2026 report, its highest in a while. The report covers 354,415 drives. Age is the clearest pattern: models averaging six years or older failed at about 4.00%, while models under three years old failed at about 0.99%.
This article walks through what the Q2 2026 numbers show and how to read them. It is written for storage engineers, IT buyers, and anyone who runs backups on spinning disks. Protocol Wire recalculated several figures from Backblaze's published tables, and those calculations are labeled as ours.
What Backblaze's Q2 2026 Drive Stats Report Measured
Backblaze runs a cloud storage service, so its drives work in production, not on a test bench. In its Q2 2026 Drive Stats report, the company monitored 359,101 drives from April 1 to June 30. It removed 3,881 boot drives and 705 drives that missed its inclusion criteria, which left 354,415 for analysis.
Those drives logged 31,553,350 drive days and 1,498 failures. That works out to a quarterly annualized failure rate of 1.73%, which Backblaze called the highest in quite a while. The company also reported no new drive models for the second quarter in a row, so the fleet mix barely changed.
Any defect rate drawn from a tiny lot deserves distrust. Backblaze's fleet is large enough that the fleet-wide number is a real signal. The per-model numbers need more care.
What Is an Annualized Failure Rate and How Is It Calculated?
An annualized failure rate (AFR) is the number of drive failures divided by total drive days, multiplied by 365 and expressed as a percentage. It converts failures across drives that ran for different lengths of time into one yearly figure. Backblaze's Q2 2026 fleet works out to 1,498 failures over 31,553,350 drive days, or 1.73%.

A drive day is one drive running for one day. Counting drive days matters because drives enter and leave the fleet mid-quarter. Ten drives that each ran 30 days contribute 300 drive days, no matter when they were installed.
Backblaze's lifespan research shows why a yearly framing helps. In its drive lifespan study of more than 200,000 drives, the company found that about 90% of the drives it owned had lasted four years, and 65% had lasted longer than six. That study reflects a smaller, older fleet than the 2026 data, so treat those percentages as historical context.
Backblaze also sets minimum sizes so tiny samples do not distort a table. A model needs more than 100 drives and 10,000 drive days to appear in the quarterly table. The lifetime table requires more than 500 drives and 100,000 drive days.
Why Older Drives Push Hard Drive Failure Rates Up

Age is the strongest pattern in the Q2 table. We grouped the 31 drive models by Backblaze's reported average age and recalculated the failure rate for each group. The table below shows failure rates by average model age in Q2 2026.
| Average model age | Drives | Share of drives | Share of failures | AFR |
|---|---|---|---|---|
| 72 months or more | 52,766 | 14.9% | 34.2% | 4.00% |
| 36 to 72 months | 161,667 | 45.6% | 43.5% | 1.63% |
| Under 36 months | 139,982 | 39.5% | 22.2% | 0.99% |
The oldest group is 14.9% of drives but 34.2% of failures. The youngest group is 39.5% of drives but 22.2% of failures. One caveat applies: we grouped by each model's average age, not each drive's age, and age overlaps with capacity and vendor. Read it as a pattern, not a controlled experiment.
Backblaze's outlier list backs this up. Three models topped 6.95%, the cutoff its quartile analysis set for outliers: the HGST HUH721212ALN604 at 7.63%, the Seagate ST10000NM0086 at 9.33%, and the Seagate ST14000NM0138 at 8.26%. Backblaze noted that the HGST drive is nearly seven years old and the 10TB Seagate is nearly 8.5 years old. You can compare these results against earlier quarters in Backblaze's archive of Drive Stats reports.
One detail is worth flagging. Backblaze's text counts seven non-outlier models above 3.0%, or 10 of 31 including the three outliers. Counting the published table, we get eight and 11. The fleet-wide story does not change, but it is a reminder to check the tables and not only the summaries.
Small Fleets Make Failure Rates Look Extreme
A small sample can turn a handful of failures into a scary percentage. The Seagate ST10000NM0086 had 965 drives and 22 failures, for an AFR of 9.33%. The Seagate ST14000NM0138 had 1,235 drives and 25 failures, for 8.26%.
The same effect flatters good numbers. Three models posted zero failures: the 8TB Seagate ST8000NM000A, the 12TB ST12000NM000J, and the 14TB ST14000NM000J. Their fleets were 239, 1,079, and 497 drives. A zero on 239 drives is a nice quarter, not proof of reliability.
Here is how sensitive the math is. The 16TB Seagate ST16000NM000J had 171 drives and one failure, which produced an AFR of 2.57%. A second failure would have doubled it. The model appears in the table because it clears Backblaze's cutoff of 100 drives and 10,000 drive days.
In vendor qualification data, a percentage without a denominator is a press release. Always read the drive count next to the AFR.
Do 20TB-Plus Hard Drives Fail More Often?
Not so far in Backblaze's data. The five 20TB-plus models in the Q2 2026 table logged a combined AFR of 1.00% across 97,398 drives, against 2.00% for the 26 smaller models. Those big drives are young, though, so this is an early read rather than a verdict on long-term reliability.

The five models are the 20TB Toshiba MG10ACA20TE, the 22TB WDC WUH722222ALE6L4, the 24TB Toshiba MG11ACA24TE, the 24TB Seagate ST24000NM002H, and the 26TB WDC WUH722626ALE6L4. Their average ages run from 3.4 months to 19.1 months. None has been through the years of wear that dominate the older groups.
One model stands out. The Seagate ST24000NM002H posted 3.30% at an average age of just 12.2 months, with 78 failures across 9,631 drives. That is the highest rate of any 20TB-plus model, and it is worth watching. The 22TB WDC model, with 45,665 drives, posted 0.55%, the lowest of any model with more than 10,000 drives.
Backblaze also noted that new deployments are concentrating in the 20TB-plus class. Those drives will carry more of the fleet each quarter. That makes their failure rates the numbers to watch.
The full dataset is free, so you can test this yourself. Backblaze's Hard Drive Test Data page offers quarterly CSV files, and the Q2 2026 file is a 2.1 GB ZIP. Backblaze asks that you cite it as the source and do not sell the data.
SMR and HAMR: What Comes Next for Hard Drive Reliability Data
Backblaze's Q2 report spends its second half on two capacity technologies. Conventional magnetic recording (CMR) places data tracks side by side with guard space between them. Shingled magnetic recording (SMR) overlaps the tracks like roof shingles, which adds roughly 10% to 25% more capacity depending on the implementation.
The trade-off is rewrites. Updating data in the middle of an SMR band can force the drive or the host software to reorganize a larger zone. Backblaze describes three flavors: drive-managed, host-managed, and host-aware. It says no SMR drives are in its fleet today, and it will flag them as they arrive.
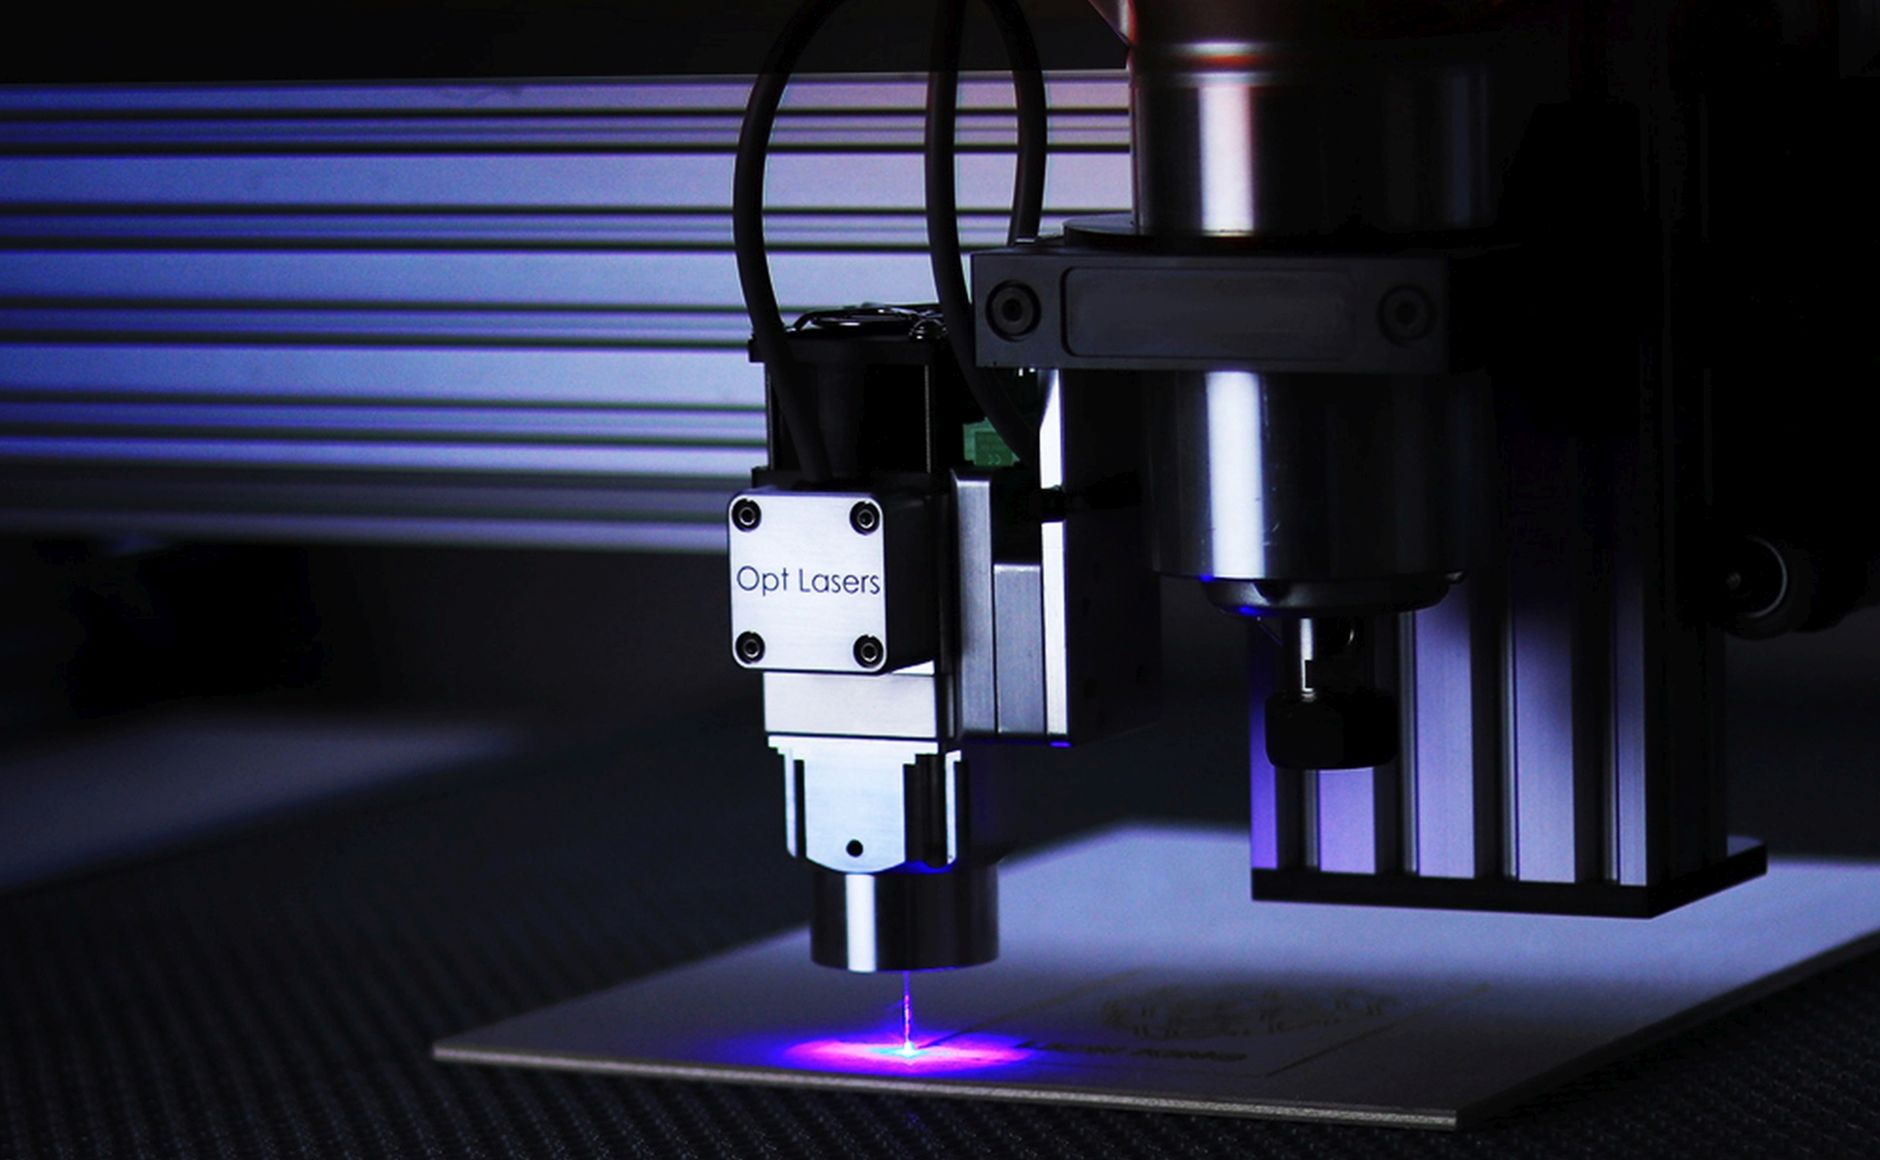
Heat-assisted magnetic recording (HAMR) attacks density differently. A small laser diode on the write head briefly heats a tiny spot on the platter, which lets the head flip a very stable magnetic bit. Seagate says its HAMR-based Mozaic 3+ platform reaches 3TB per disk and beyond, and that each bit heats and cools in a nanosecond.
Backblaze notes that SMR and HAMR solve different problems, so makers can combine them. Its short answer to "SMR or HAMR?" is "mostly yes." That describes capacity plans, not reliability results. Seagate's figures are a vendor claim, and vendor claims are roadmap until a large fleet publishes an AFR. The same goes for AI chip press releases.
How to Read a Drive Failure Table Before You Buy or Deploy
Use this five-step check on any drive reliability table, whether it comes from Backblaze or anyone else.
- Check the drive count next to every AFR. Below a few thousand drives, treat the percentage as noisy.
- Check the average age. A 4% AFR on seven-year-old drives is a different problem than 4% on one-year-old drives.
- Check drive days, not only drive count. A model that joined the fleet last month has not had time to fail.
- Compare models, not brands. In Q2 our vendor averages ran from 0.92% for WDC to 4.72% for HGST, but the HGST figure is driven largely by one model averaging 83.8 months old.
- Compare against your own workload. Your cooling design, redundancy, and write patterns may differ from a cloud storage provider's.
Here is why step four matters. Seagate ran at 2.07% and Toshiba at 1.40% on our recalculation. Those numbers reflect which models each vendor happened to have in the fleet, not a clean ranking of vendors.
The Bottom Line on Q2 2026 Hard Drive Failure Rates
The practical answer is simple. The fleet-wide rate of 1.73% is real, but aging models and a few small fleets with outsized rates pull it up. Newer, larger drives are holding up well in their first year or two.
Your next step is to pull the Q2 CSV and sort it by age before you trust any single AFR, then fold the result into your replacement budget. Our piece on real infrastructure costs shows where those line items hide. Protocol Wire covers hardware reliability through published data like this, not vendor roadmaps. Then watch three things next quarter: the 24TB Seagate at 3.30%, the three outlier models, and the first SMR drives to enter the fleet. Backblaze is hosting a Drive Stats webinar on Thursday, October 8 at 12 p.m. PT for anyone who wants the company's own walkthrough.

